By Bill Kreuser, PhD
We first started talking about PGR growing degree day (GDD) models back in 2008. These models use daily average air temperature to estimate PGR longevity and help schedule PGR re-application events. The original model was limited to Primo Maxx applications on bentgrass putting greens. Since then, we’ve expanded our models to dozens of different grass species and management areas (greens, fairways, fields and lawns) and PGR ingredients. We’ve also validated the models with the help of our other turfgrass scientists across the United States.
During the recent off-season, we’ve been working to create version 2.0 of the PGR GDD model. The goal of this new model was to account for PGR mixtures, show how stacking PGR applications can intensify suppression, and include growth suppression estimates for DMI fungicides. This new version of the PGR (DMI) GDD Models is now live for GreenKeeper Premium Members.
Model Development
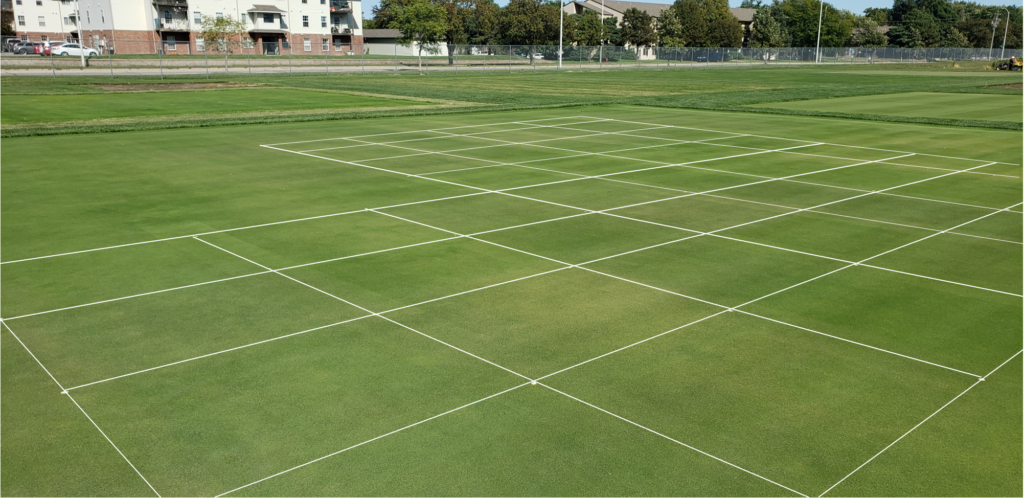
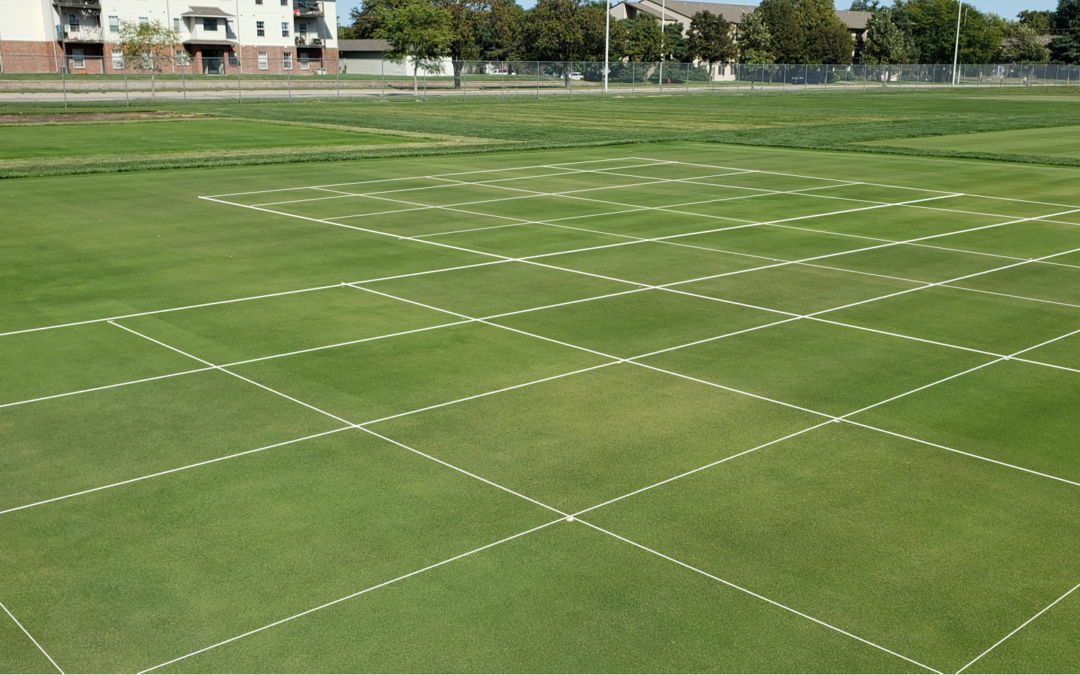
This new model has been developed from our twelve years of PGR research data. We have also started new field and growth chamber studies to specifically understand how PGR/DMI mixtures impact cumulative yield suppression intensity and duration (Fig. 1). Version 2.0 of the GDD model analyzes each individual PGR/DMI independently and then uses those results to predict the cumulative effect on growth rate.

GDD Models for DMI Fungicides
Class B PGRs like paclobutrazol (Trimmit 2SC) and flurprimidol (Cutless) can also be classified as DMI fungicides. Likewise, DMI fungicides can also be classified as Class B PGRs. Since the PGR GDD models work for Class B PGRs, we figured that we could create GDD models for DMI fungicides. Our data is very preliminary and consists of direct tests (Fig.1) plus a meta-analysis of existing research data. Fortunately, these DMI GDD models mirror the Class B PGR models. The amount of suppression varies with product and application rate. Product duration is dependent on air temperature (GDDs).
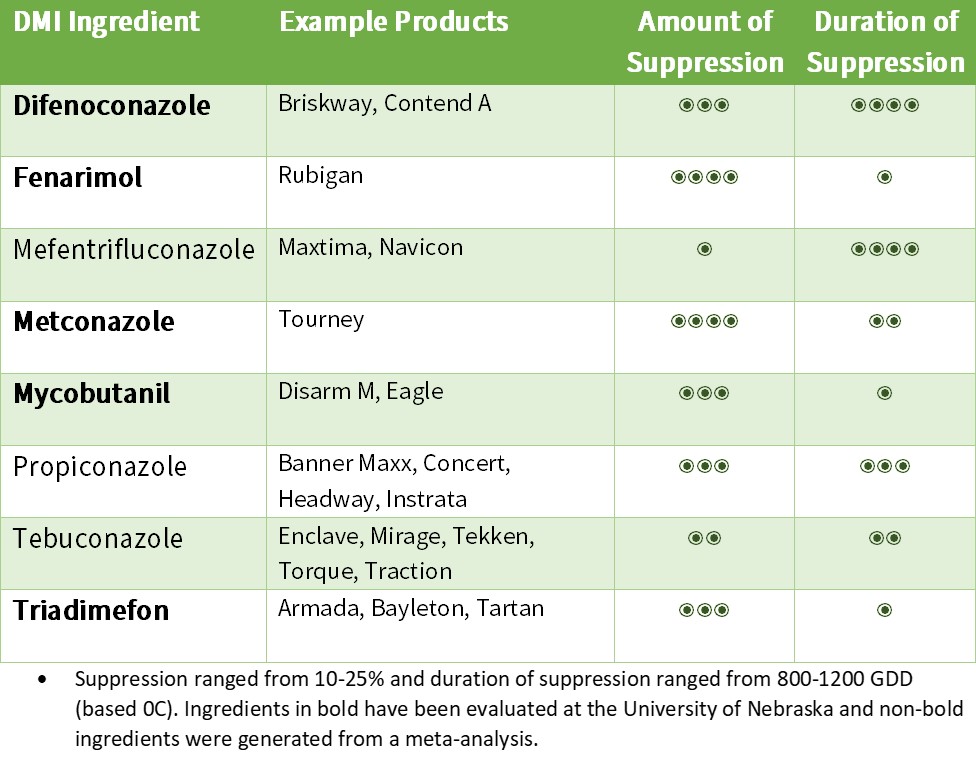
A relative list of growth inhibiting properties can be found in Table 1. It’s important to note that these DMI models predict the growth response of the turf and NOT the length of disease suppression. Growth suppression is a plant effect while disease suppression is a fungi effect.
Table 1. Very preliminary data of DMI clipping yield suppression on creeping bentgrass golf greens. Suppression ranged from 10-25% and duration of suppression ranged from 800-1200 GDD (based 0C). Ingredients in bold have been evaluated at the University of Nebraska and non-bold ingredients were generated from a meta-analysis.

Integration into GreenKeeper App
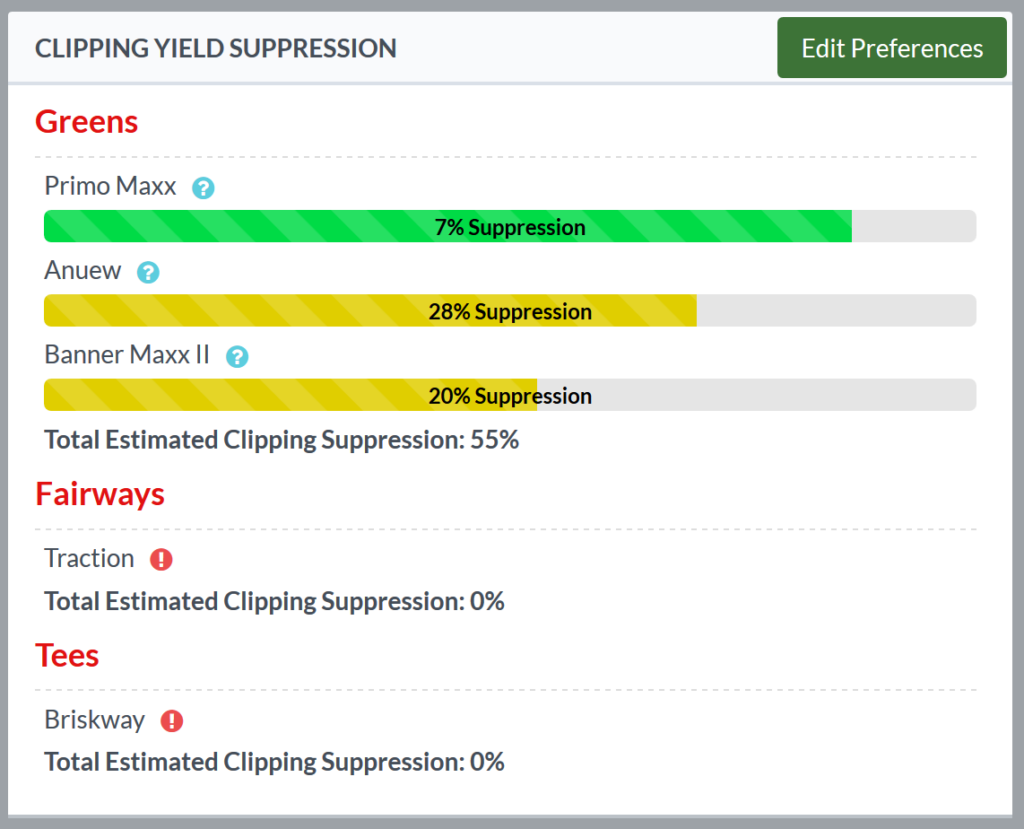
Because these models are complex, they are only available in the GreenKeeper App. Programs like Excel or Google Sheets cannot easily load the results of multiple PGRs and DMIs at the same time. The Cumulative Yield Suppression Dashboard (located above the Fertilizer Dashboard on GreenKeeper Premium) displays a list of all products known to affect growth rate and then calculates the “Total Estimated Clipping Suppression” for each area at your facility (Fig. 2).

The color of the bar represents the amount of clipping yield suppression and the length of the bar indicates the duration of the clipping suppression phase for each product. You’ll notice that the suppression duration (GDD) is different than the “Re-application Interval GDD” on the Product Expiration Lifetime Dash. This is because PGRs need to be re-applied before the suppression phase is over to sustain suppression. The blue question mark provides additional application details (date, rate, GDD). The red exclamation mark indicates these products can suppress yield, but a GDD model doesn’t exist in GreenKeeper for that product and/or area.
Stop Guessing When Mixing PGRs and DMIs
This new GreenKeeper Premium features is sure to help minimize the guess work when scheduling PGR and DMI applications. We are also working on a way to recalculate suppression for collars from past putting green application records. This will surely help our users understand PGR over-regulation & collar decline. Another feature in the works is to display the estimated peak suppression when an application is being logged in GreenKeeper. Users can edit PGR application rates to find the amount of suppression they would like from an application. Joining GreenKeeper Premium allows us to reinvest in features like this and helps you take the guesswork out of your management program.


Trackbacks/Pingbacks