
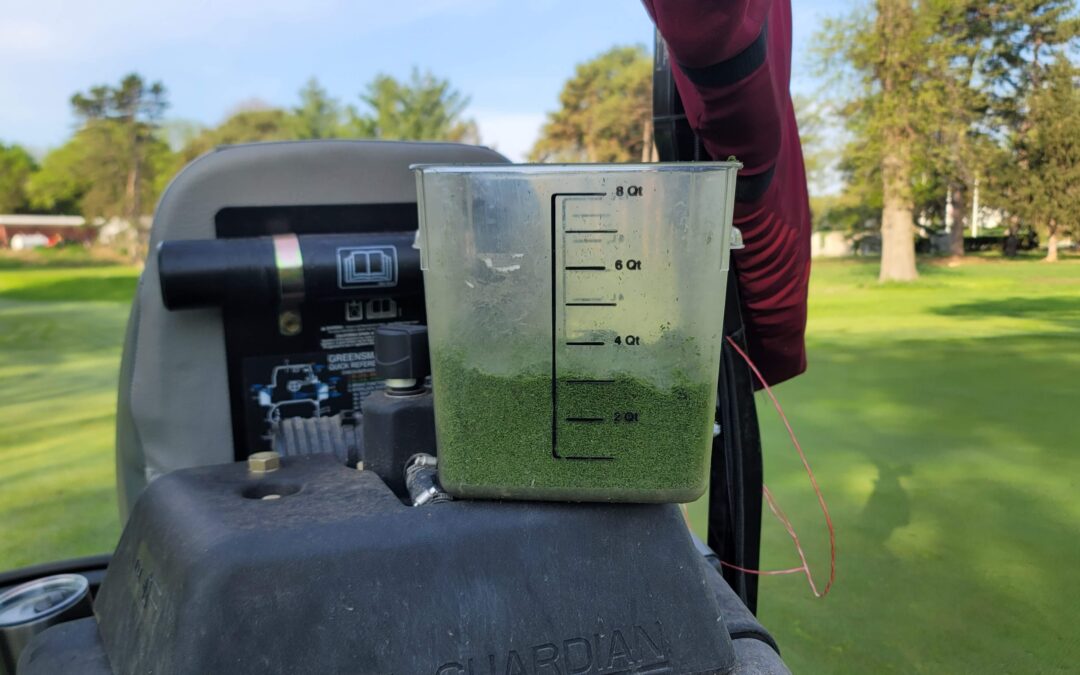
We have been advocating daily measurement of growth rate on highly maintained turfgrass to improve management precision. Clipping volume measurements provide actionable data to help guide PGR applications and evaluate the efficiency of a fertilization program. But how much growth is required on a given day? Relating ClipVol to other turf performance metrics like turf quality and green speed can quickly answer that questions.

Establishing a Target Growth Rate
Remember the first time you stuck a soil moisture probe into the ground to measure volumetric water content? The high-tech meter provided you with a very precise moisture content, but what did that number mean? It was only after taking numerous measurements over days and weeks that the value displayed on the moisture meter became meaningful. Measure soil moisture under wilting turf to establish a bottom range and then measure moisture after a heavy irrigation night to establish a top range. Then with more experience, you settled on a normal management range that kept the turf healthy but not too wet.
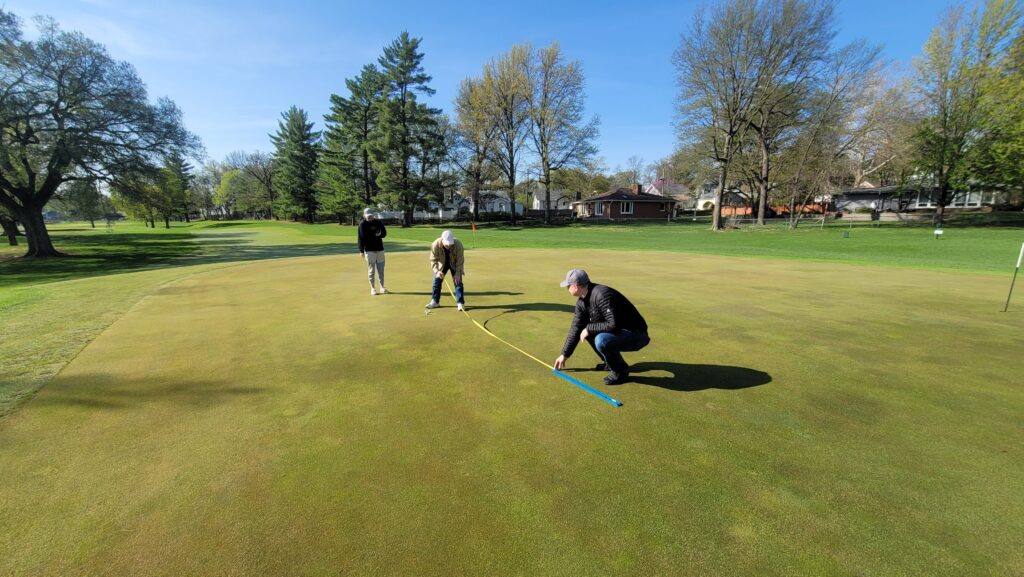
This process of ground truthing is required to give context to turf management data. What is the green speed today and is that “normal” or “in-range” for your course? How’s the color of the athletic field today and is that meeting expectations? Routine observations of turf performance can help establish acceptable ranges for different data metrics. The same method can be used to determine an optimum growth rate with ClipVol data.
For golf putting greens, the turf should be growing just fast enough to recover from wear and traffic (golfer traffic, mechanical damage, old cup and ball mark recovery, etc.). Likewise, excessive growth can lead to rapid thatch accumulation requiring more cultivation and declining playability (low green speed and poor ball roll quality). Many courses set an ideal range between 0.7 and 1.5 quarts per 1000 square feet (liters per 100 square meters), but those values depend on the grass species, collection method, traffic, soils, etc. Just like the moisture meter, every course will have a different management range.
Fertilize First and Control Growth Second
I like to describe managing growth rate like driving a car or truck. The accelerator pedal increases the vehicle’s speed while the brake pedal has the opposite effect. For growth rate, nitrogen fertilizer acts as the accelerator and the PGRs (and DMI fungicides) act as the brakes when other factors such as weather and soil moisture are held constant. So which growth management lever should be used first? You wouldn’t drive down the highway with your foot on the brake and accelerator.
Just like driving a vehicle where the accelerator takes precedence, nitrogen should be used first to improve turfgrass health, density, color and clipping yield. Metrics including visual assessment of turfgrass performance, clipping volume measurements, and data from mower and drone-mounted sensors can be helpful when making these nitrogen fertilizer judgements. Worried that extra N will increase growth rate and stymie green speed? Don’t. Doubling normal spoon-feeding rates on greens will dramatically improve turfgrass health and traffic tolerance but will only increase clipping volume by 20-30%. Research shows this increase will have no impact on green performance metrics like green speed.
If growth rate is above the desired level, then use PGRs to suppression clipping volume. Higher PGR application rates increase the amount of suppression – although some labels restrict rates to achieve higher suppression levels. Alternatively, higher levels of suppression can be achieved with combinations of different PGRs. Mixing PGRs and DMIs has an additive effect on clipping yield suppression. It’s possible to achieve 90% yield suppression with tight intervals of multiple PGRs.
Is Clipping Volume Measurement Worth It?
I’ve been tracking growth rate with clipping volume for the past four seasons. Here’s how I do it. I find the quick practice helps me in the following ways:
- PGR and DMI rate guidance: I adjust PGR rates and combinations to help achieve a desired growth rate where the turf can recover from traffic but still provide great performance.
- Schedule mowing and cultivation: When ClipVol is low, I’ll skip mowing events and roll instead. I’ll also topdress more aggressively during high growth compared to low growth.
- Assess fertilizer efficiency: By tracking clipping volume every day, I can estimate total annual clipping yield and nutrient removal from mowing alone. Then I’ll compare the amount removed during mowing to the amount applied as fertilizer over the course of the year. Are they relatively close or grossly different?
After 15 years of PGR research, I cannot imagine planning fertilizer and PGR inputs without daily measurement of growth rate. GreenKeeper App makes it easy to log these measurements and relates them to my management. Our machine-learning/artificial intelligence models will go live this summer. They will further improve our ability to predict growth rate based on a course’s own clipping volume data. Start tracking your growth and turf performance data in GreenKeeper App this season. Watch the tutorial below to see how easy it is to use. Register today and begin your free trial at GreenKeeperApp.com.