By Bill Kreuser, PhD
Turfgrass response to nitrogen fertilizer depends on many factors like temperature, sunlight, water availability, root health, and soil compaction. Some factors like soil water content and compaction can be altered by turf managers with irrigation and cultivation. Other factors like sunlight (cloud cover) and air temperature are beyond our control. Various growth potential models exist that can help managers predict how these types of factors impact turfgrass growth rate. While all models at their core are incorrect, they can provide a clue as to what is going on in a complex system.
There are now three different growth potential models in GreenKeeper Premium. They include the PACE Turf Growth Potential Model, the Nebraska Nitrogen Responsiveness Model and the Mississippi State Bermudagrass Growth Potential. All of these models use air temperature to estimate the potential for turfgrass to growth.
Defining Growth Rate
Plant growth rate can be defined in different ways including weight gained, vertical growth rate, root biomass production, tiller density, or clipping production. It’s important to distinguish how growth is defined because increased growth in one plant part might reduce growth in another plant part. For example, over-fertilizing with nitrogen can stimulate excessive top growth (clipping yield) and reduce root biomass. Also, shade reduces sugar production during photosynthesis (less weight added) but clipping yield is enhanced under shade. The grass is trying to outgrow the shade which further depletes sugar reserves. The various growth models in GreenKeeper predict different types of growth rate.
PACE Turf Growth Potential Model
Description:
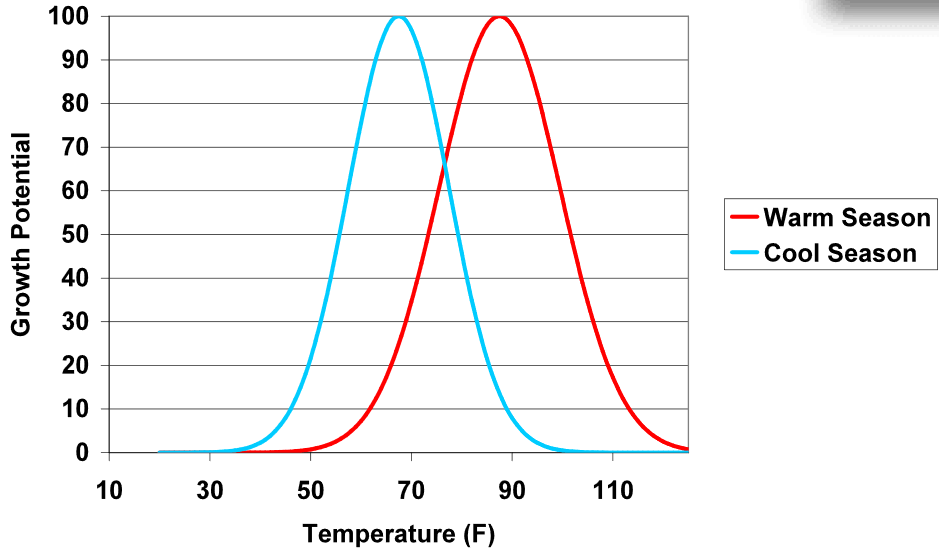
This growth potential model uses air temperature to estimate growth rate on a weight basis. The ideal temperature to maximize photosynthesis is generally accepted to be 68°F for cool-season plants and 87°F warm-season plants. This model uses those temperatures as peak values that decline as the temperature gets cooler or warmer than optimum (Fig. 1). Click here for more info.

Weaknesses:
This is a theoretical model that assumes clipping production mirrors sugar production (photosynthesis). Calibration data from the northern Midwest has found that this model tends to over-estimate clipping yield in late spring and early fall and underestimate clipping yield during summer. This model also assumes that all cool and warm-season species have the same peak temperatures. Field data suggests that some species like bentgrass “prefer” warmer weather than species like annual bluegrass.
Use Recommendation:
I tend to think about this model as an indicator of sugar production and not clipping yield. When observed clipping yields are low but PACE Growth Potential is high (think fall), then it’s easy to believe that the plant is storing sugars or using them in different ways (roots, density, etc.). When clipping production is high but Growth Potential is low, then I think the plant is rapidly burning stored sugar (i.e. summer). This can lead to the death of the plant if it occurs for too long. It’s good for managers to have a rough idea of the sugar status of the plant and this model helps with that assessment.
Nebraska Nitrogen Responsiveness Model
Description:
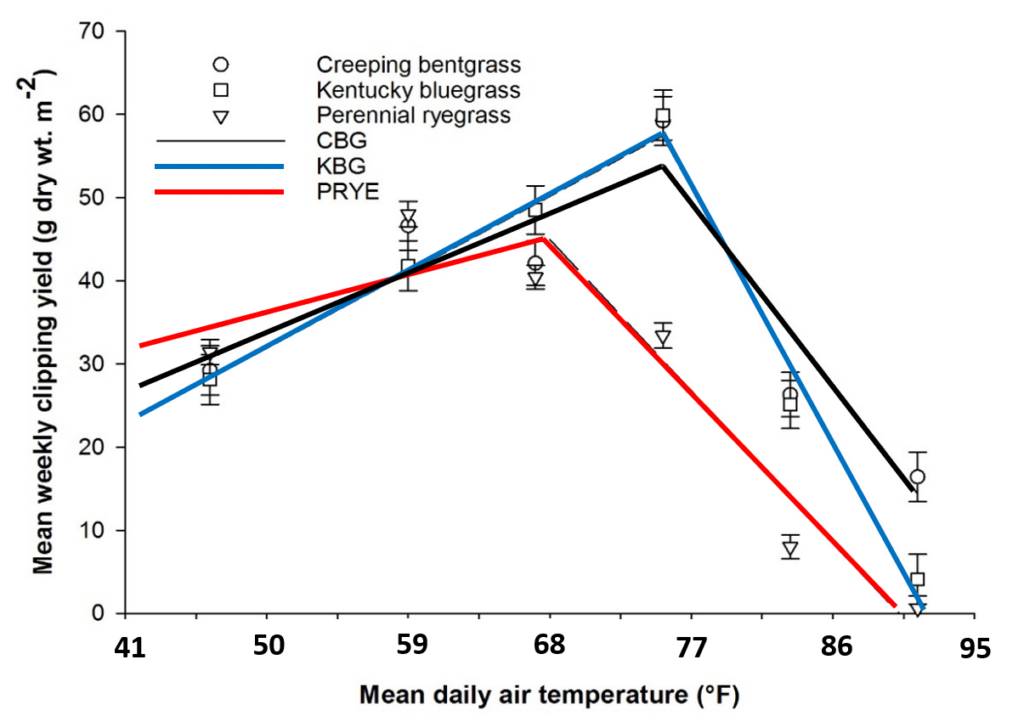
Clipping yield response to nitrogen fertilizer changes with temperature. The clipping yield response to a half-pound of N fertilizer is very different when the air temperature is 70°F compared to when the air temperature is 85°F. This model attempts to predict how clipping yield will respond to nitrogen availability at different average air temperatures. A low percentage means that growth response to N will be small and a high percentage means that clipping yield will increase noticeably with added nitrogen.
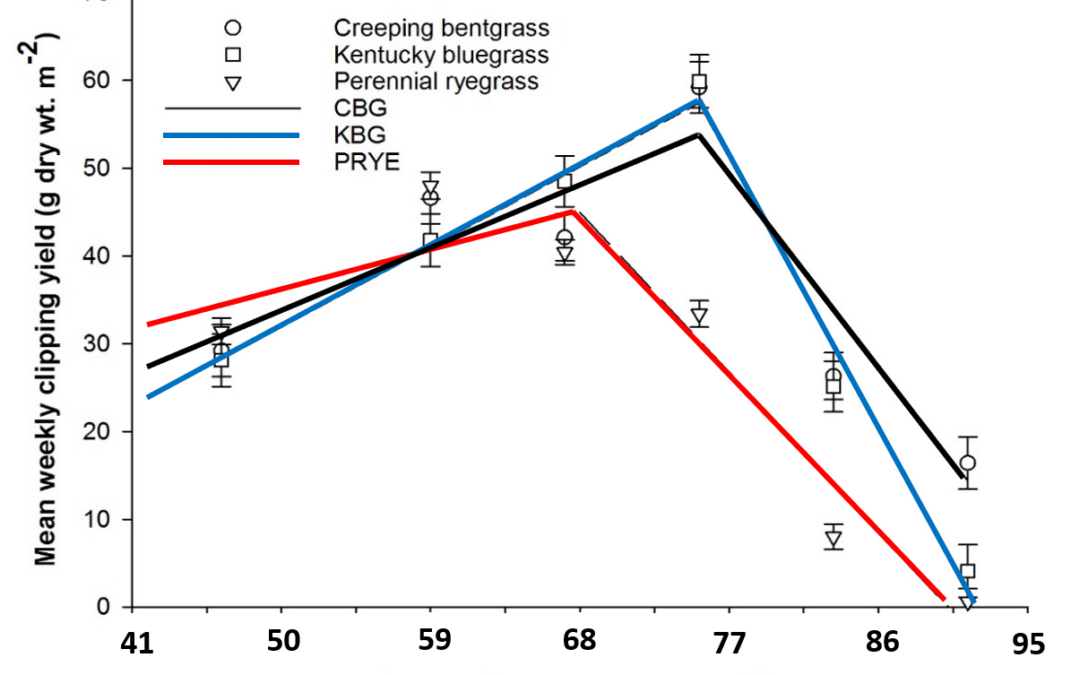
This new model was developed in the controlled environment of a growth chamber. It uses average air temperature to estimate how clipping yield responds to nitrogen fertilizer (Fig 2). Kentucky bluegrass, creeping bentgrass, and perennial ryegrass clipping yield was measured weekly following treatment with nitrogen fertilizer. It is currently being expanded to more warm- and cool-season grass species.

Weaknesses:
There are also weaknesses with this model. First, it was conducted under the extreme environmental controls of a growth chamber with one cultivar for each grass species. It was also conducted for a period of eight weeks (including an initial acclimation phase in the growth chamber). The model outputs the relative percentage of a maximum clipping yield response. It is not n absolute value like 0.25 lbs of N increases clipping yield by 1 qt of clippings per 1000 ft2. Also, it may not be directly linked to sugar production and should only be applied to actively growing grass. It is not applicable for turf that is entering, in or breaking winter dormancy.
Use Recommendation:
This model can help turfgrass managers select a nitrogen rate when striving to meet growth rate goals. I imagine this model like the selecting a gear in your truck. In a high gear/N response, only small amounts of nitrogen are required to stimulate a large growth response. In lower gear/N response, higher application rates will be needed to get a significant clipping yield response. When the Nitrogen Responsiveness Model is very low, withhold nitrogen because the turf is well outside it’s normal growing window.
Mississippi State Bermudagrass Growth Potential Model
Description:
This model was developed by the Turfgrass Team at Mississippi State University. It was conducted in highly controlled SPAR greenhouses. In these units, the researchers could control temperature, water and fertilizer but natural sunlight drove photosynthesis. By changing the temperatures in the different SPAR units, the researchers could model the impact of air temperature on clipping yield and root biomass of different bermudagrass cultivars.
Weaknesses:
This type of model has similar weakness to the Nitrogen Responsiveness model described above. It was conducted in a controlled environment over a few weeks, and the turfgrasses were actively growing at the start of the study. The rooting data was very intriguing and requires more study. The model suggests that root biomass production declined with increasing air and soil temperature. This was unexpected for warm-season turfgrass grasses like bermudagrass. Like the the other models, there is still many unknowns with regard to biomass production and net photosynthetic capacity.
Use Recommendations:
This model provides an estimate of bermudagrass clipping yield and root biomass production. It has a minimum temperature of 55°F. It provides a useful tool to guide bermudagrass management practices once it has broken winter dormancy.
The future of modeling turfgrass growth rate
There is potential to build additional and more complex growth models with factors like sunlight, water status, crop reflectance (sensors on mowers or drones) and estimates of soil nitrogen mineralization. Such models could further help guide management decisions like nitrogen fertilization, irrigation ,cultivation, and PGR applications. Even more sophisticated models are being developed with the help of artificial intelligence and machine learning algorithms. Doug Soldat’s PhD student, Ada Zhou, is using computers to build growth models that are specific to an individual golf course or turf site. It is our goal to create these “hyper-local” models for our GreenKeeper members in the future. Entering data like clipping volume into Performance Tracker, logging all your PGR and fertilizer applications, and soil testing with GreenKeeper today will help us implement these models at your course in the future.


Trackbacks/Pingbacks