I received an interesting question following a plant growth regulator (PGR) programming webinar. The webinar covered introductory PGR topics including: PGR degradation and removal, prediction of PGR performance with growing degree day (GDD) models, and clipping volume collection. The attendee asked,
“Do superintendents need to use PGR GDD models if they are already collecting clipping volume each day?”
While it may seem that PGR GDD models and clipping yield measurements provide similar information, they are actually quite different and equally helpful. The difference is between the absolute and relative clipping yield. Let’s dig deeper.
Clipping volume
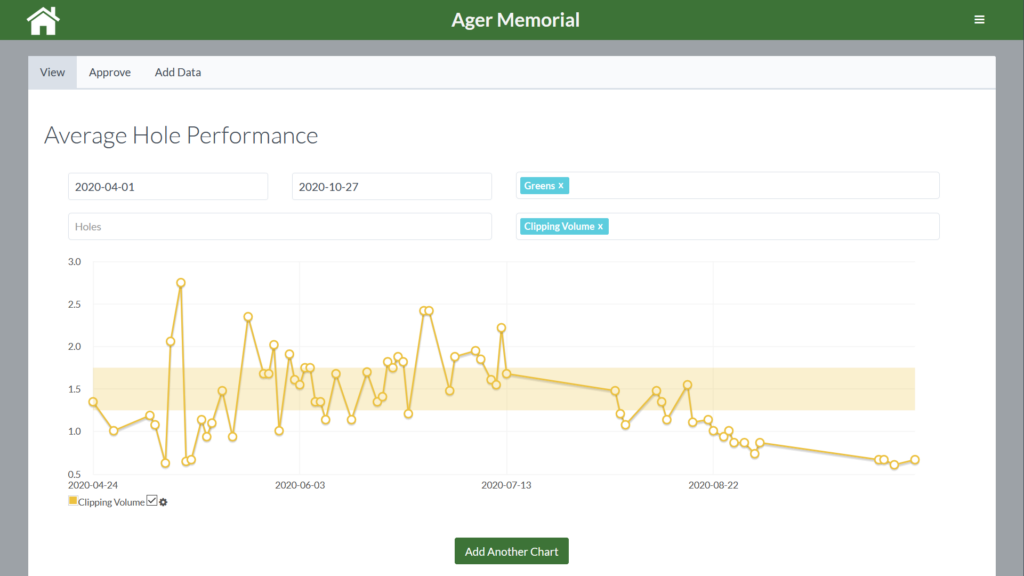
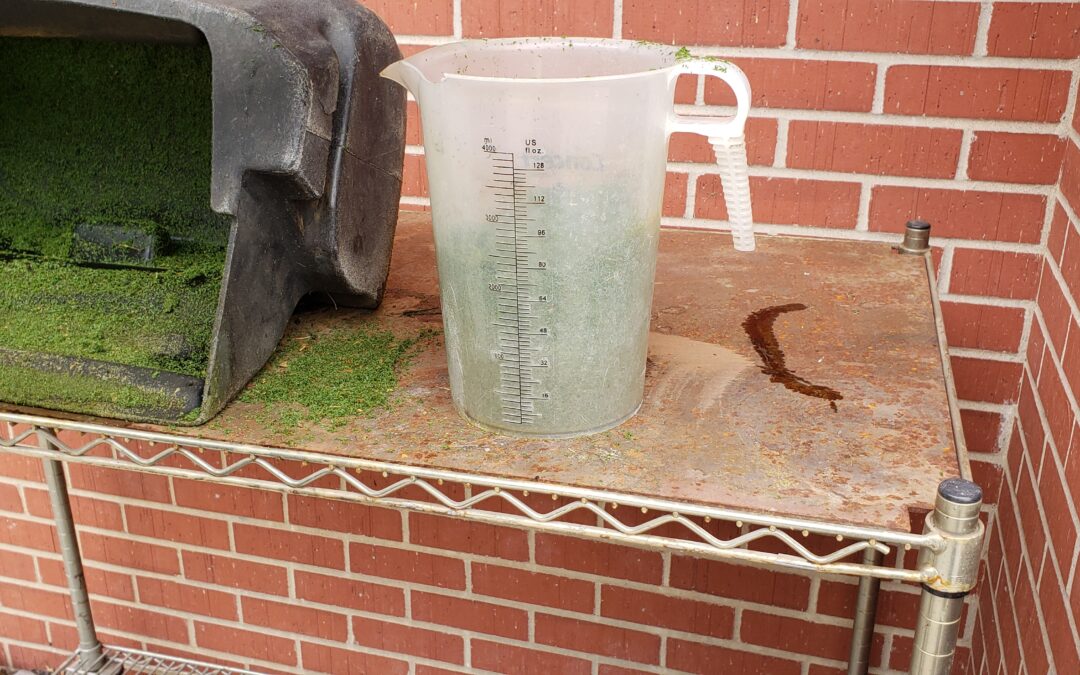
Clipping volume/yield is the actual amount of growth produced between mowing events. It is easily measured and is influenced by several factors including: temperature, nitrogen and water availability, soil microbial communities, genetics, etc. It is important because the clipping volume is directly related to traffic tolerance, sugar partitioning (i.e. roots vs leaves vs crowns), nutrient requirements (increased growth elevates demand for soil nutrients), disease susceptibility and recovery, and turf performance like green speed. Most turfgrass managers intuitively have some idea of growth they need to maximize performance and health of their turf. Clipping volume measurements help managers define a specific growth value for their course and manage towards that goal.
Clipping volume is analogous to the speed on the speedometer of a car or truck. Clipping volume measurements reveal the rate of leaf growth just like a speedometer reveals the speed a vehicle is traveling. Turfgrass managers can use clipping volume to help manage growth rate just like a driver uses the speedometer to obey the speed limit.
Read more about measuring clipping volume, “ideal” growth rates, and managing based on your lawn mower.
PGR GDD Models
The PGR models in GreenKeeper use GDDs to predict PGR performance based on grass species, mowing height, active ingredient(s) and application rate. Ultimately, these models provide managers an estimate of how long a PGR will be effective and the relative amount of yield suppression. Relative suppression is less intuitive than clipping volume because it is more hypothetical. It is how much slower the grass is currently growing to the growth rate it would have had without the PGR application. If the grass is growing at 1 qt/1000 sqft following a PGR application and the grass that wasn’t treated is growing at 2 qts, then the PGR is providing 50% clipping yield suppression. It’s impossible to know the exact amount of suppression in the field unless there is a non-treated “check” plot for comparison.
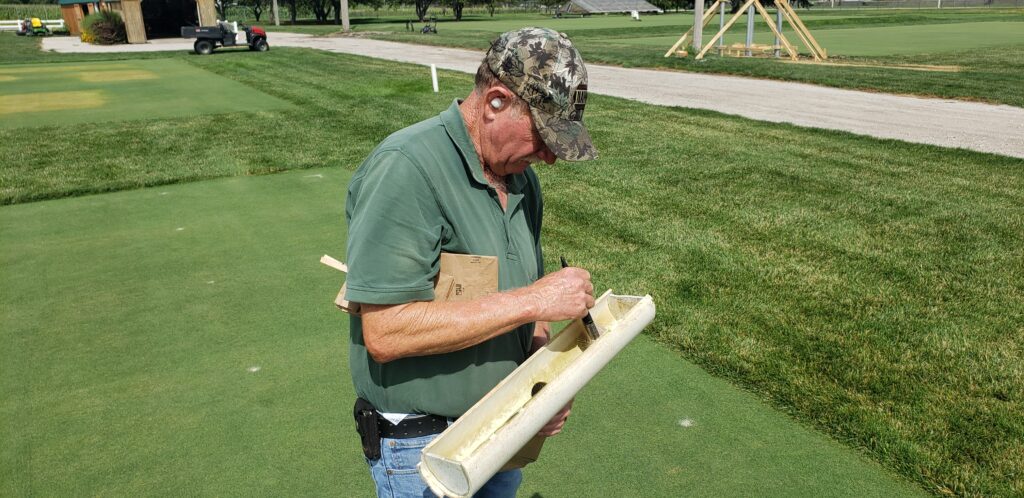
In our trials, we apply PGRs to different plots, collect clippings from those plots several times a week, and then compare the clipping yield from treated plots to the non-treated “check” plots. This is extremely time consuming and not practical in the “real-world.” GreenKeeper’s PGR GDD models are helpful because they estimate PGR performance without the need of a “check plot.”
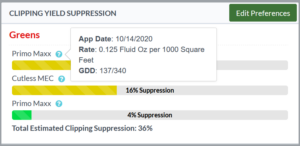
The following is an example of the PGR performance data these models provide in GreenKeeper. Cutless MEC was applied to a cool-season putting green at 12 fl oz/acre on October 14th (image below). On Oct. 27th, the Cutless MEC suppressed clipping yield by 16% and that suppression was expected to decline rapidly after Nov. 3.

Generally, PGR rate impacts the amount of clipping yield suppression while temperature (GDDs) impacts the duration of suppression within a given grass species, mowing height, etc. Mixing PGRs results in an additive amount of total suppression, to a point. The Cumulative Clipping Suppression dash on the homepage shows how combination PGR applications are impacting the amount of relative clipping yield suppression.
Here’s more information about the GDD modeling experiments for both PGRs and DMI fungicides.
Linking Clipping Volume to PGR Models
A goal of turf managers is to sustain uniform and even clipping volume production during a growing season. Unfortunately, the ever-changing growing environment causes clipping volumes to vary dramatically. This means it is inefficient to use the same nitrogen (N) rate and PGR program for the entire season. Instead managers should use clipping volume trends to guide N and PGR applications.
For example, if clipping volume is consistently double the manager’s goal, then a PGR rate or combination to suppress growth rate by 50% would be appropriate. If clipping volume is trending at or below the managers goal, then use a low rate of a single PGR and increase the N fertilizer rate.
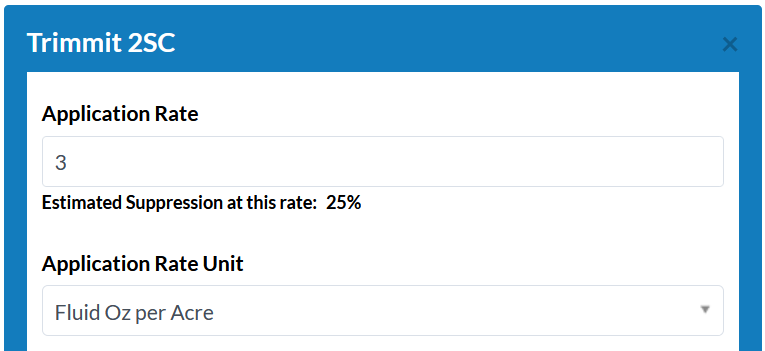
Returning to the driving analogy, use the PGR (brake pedal) and N fertilizer (accelerator pedal) to keep the clipping volume (vehicle’s speed) at the same level. If a driver sees a sign that says, “Reduced Speed Ahead, 35 MPH” but they are traveling at 60 MPH, then they’ll need to push the brake pedal harder than if they are traveling at 45 MPH. If the goal clipping volume is 1.5 qts/1000 square feet and the actual clipping yield is averaging 2.0 qts, then the superintendent would select a PGR rate that would suppress clipping yield by 25%.
Take control of growth rate with both clipping volume measurement and pgr gdd models
Clipping volume measurements are not a replacement for PGR GDD models. Just because clipping volumes trend up or down does not mean the PGR is or is not working. Without a non-treated “check” plot, it’s impossible to know if the change in clipping volume is the result of the PGR or other factors like sunlight, temperature or turfgrass genetics. The GDD models provide an estimate of PGR performance without the need of a check plot. Use clipping volume trends to understand how growth rate is changing and then use the PGR models in GreenKeeper to help take control when growth rate is more than desired.

Great blog I enjoyed readinng